Top 5 Must-have Chrome Dev Tools for Frontend Developers

Written by
Sharukh Khan
Front End Developer
Shashant Choudhary
Lead Marketing Manager
Table of contents
Build with Radial Code
A web browser is one of the most necessary tools in a developer's toolkit for testing and debugging projects. As a developer, you need to test the product on multiple parameters like accessibility, functionality, performance, and SEO, to name a few.
An ideal web browser has built-in tools allowing you to conduct testing on multiple parameters without needing to use external tools.
Nowadays, every browser offers some developer tools, but Google was the pioneer in this space with its Google Chrome browser. With its state-of-the-art developer tools and thriving community, it is well suited for beginners and season pros alike.
In this article, we share five useful Chrome Dev Tools for frontend developers that would optimize your workflow and boost productivity. Before we get started, let's quickly take a look on how to access the Chrome Command Menu.
Accessing the Chrome Command Menu
With the Google Chrome browser, you can navigate developer tools easily with a press of a keyboard shortcut. To try it, open developer tools by pressing Ctrl+Shift+I and then press Ctrl+Shift+P.

The command menu allows developers to open new tabs, switch between active tabs, and execute commands.
Now that you know how to access the command menu, let's dive into the tips we've gathered for frontend developers.
Screenshots
Screenshots are helpful when explaining features to your colleagues or simply remembering something for later. While Windows and Mac have built-in screenshot options, these tools often lack the flexibility of taking custom screenshots like scrolling through the entire page or capturing precise visible areas without having to drag the cursor over it.
With Chrome's built-in screenshot option, you can take different types of screenshots without taking your fingers off the keyboard.
To take a screenshot, follow these steps:
- Open DevTools by going to Menu ➝ More Tools ➝ Developer Tools Ctrl+Shift+I
- Click View ➝ Command Menu Ctrl+Shift+P
- Type "screenshot"
- Select the type of screenshot you want to take from the area, full size, node, or regular

Color and Images
As developers, we often come across websites with eye-catching color schemes and images that could help refine our projects.
With Chrome's built-in color-picker tools, it becomes easy to view HEX codes or RBG values of any elements.
- Open DevTools by going to Menu ➝ More Tools ➝ Developer Tools Ctrl+Shift+I
- Select any element that you want to inspect Ctrl+Shift+C
- Open the 'Styles' tab, and click on the color box
By default, it shows the color in HEX code and by navigating the up and down arrows, you can also view the RBG, HSL, and HWB values.

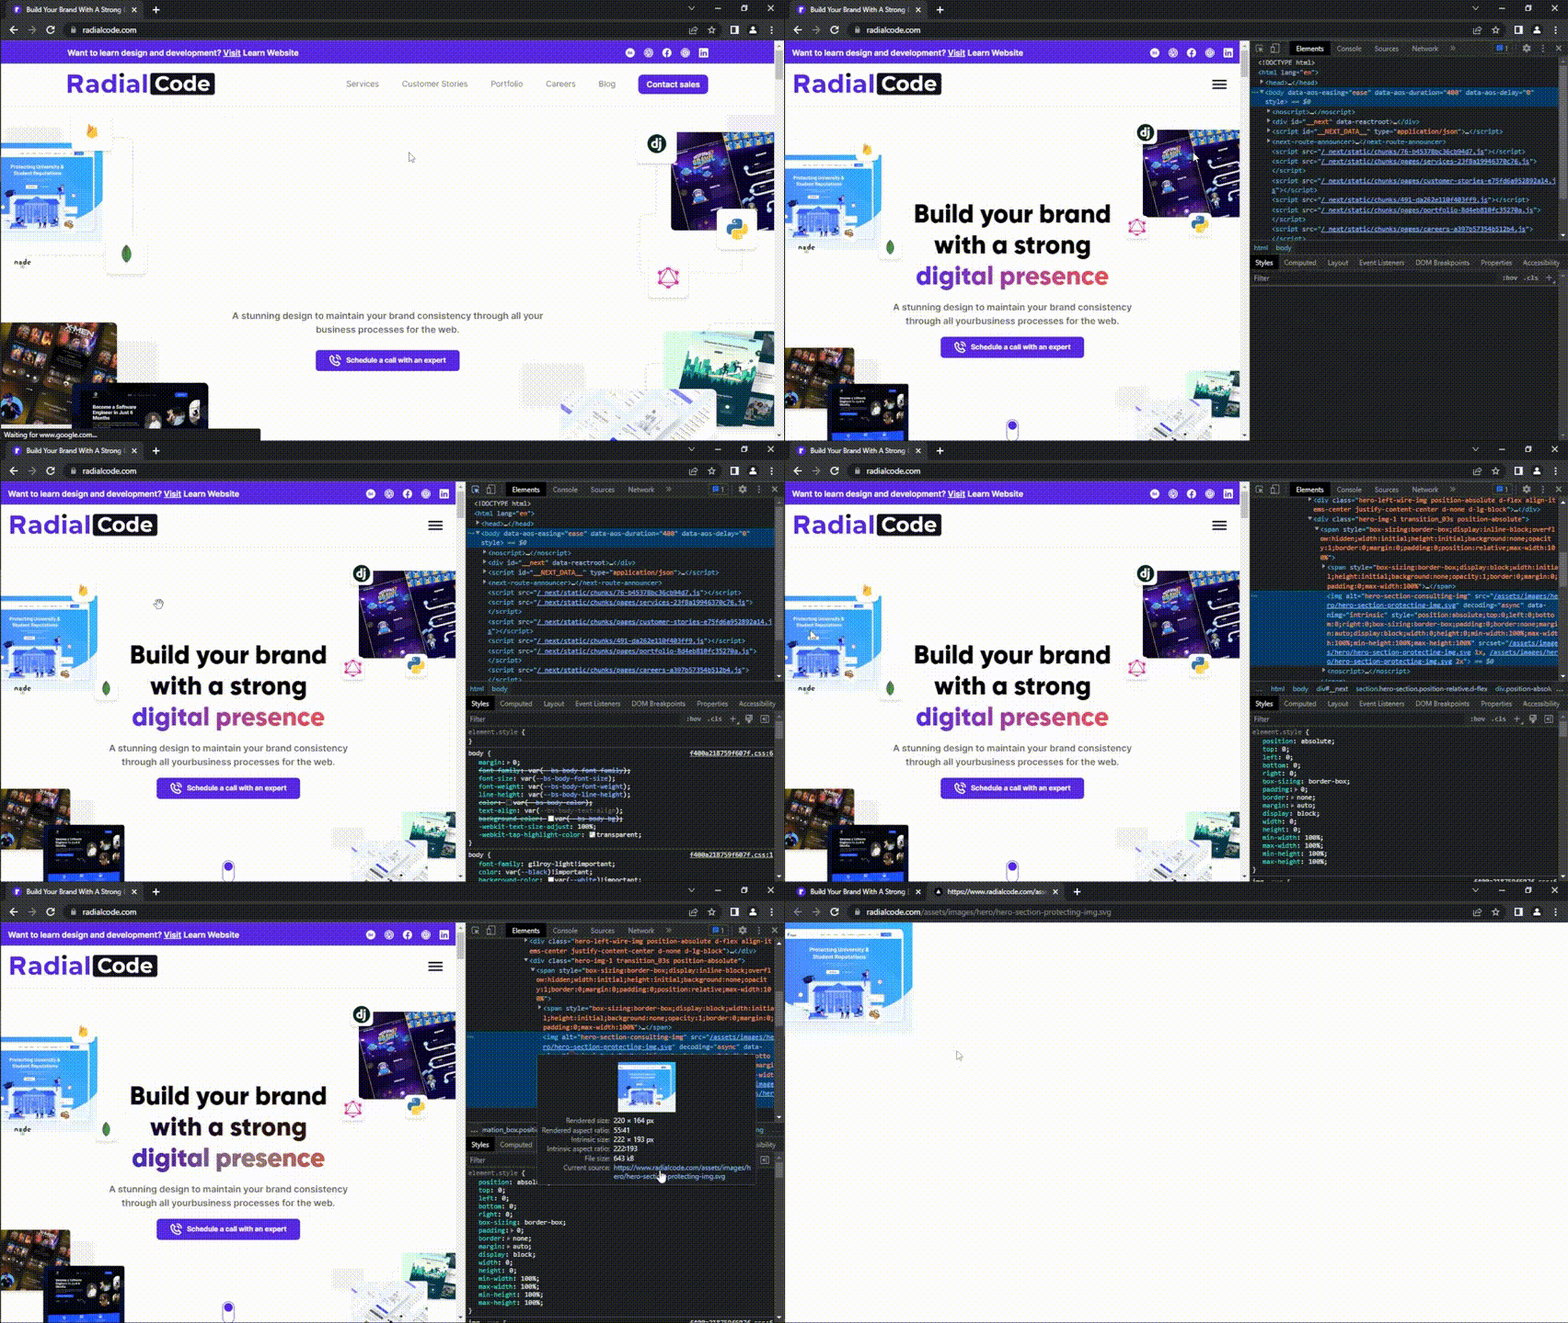
In order to access an image, the first obvious method is to right-click and copy it. For sites where this option isn't available - DevTools would help.
To access an image, follow these steps:
-
Open DevTools by going to Menu ➝ More Tools ➝ Developer Tools
Ctrl+Shift+I
- Select any image that you want to inspect
Ctrl+Shift+C
- Hover your cursor over the code until you see an overlay. Locate the field called "Current Source"
FPS Meter
FPS or Frames Per Second specifies the number of frames displayed every second on a web page. A higher FPS allows animations and other visual assets to load smoothly, contributing to a better user experience.
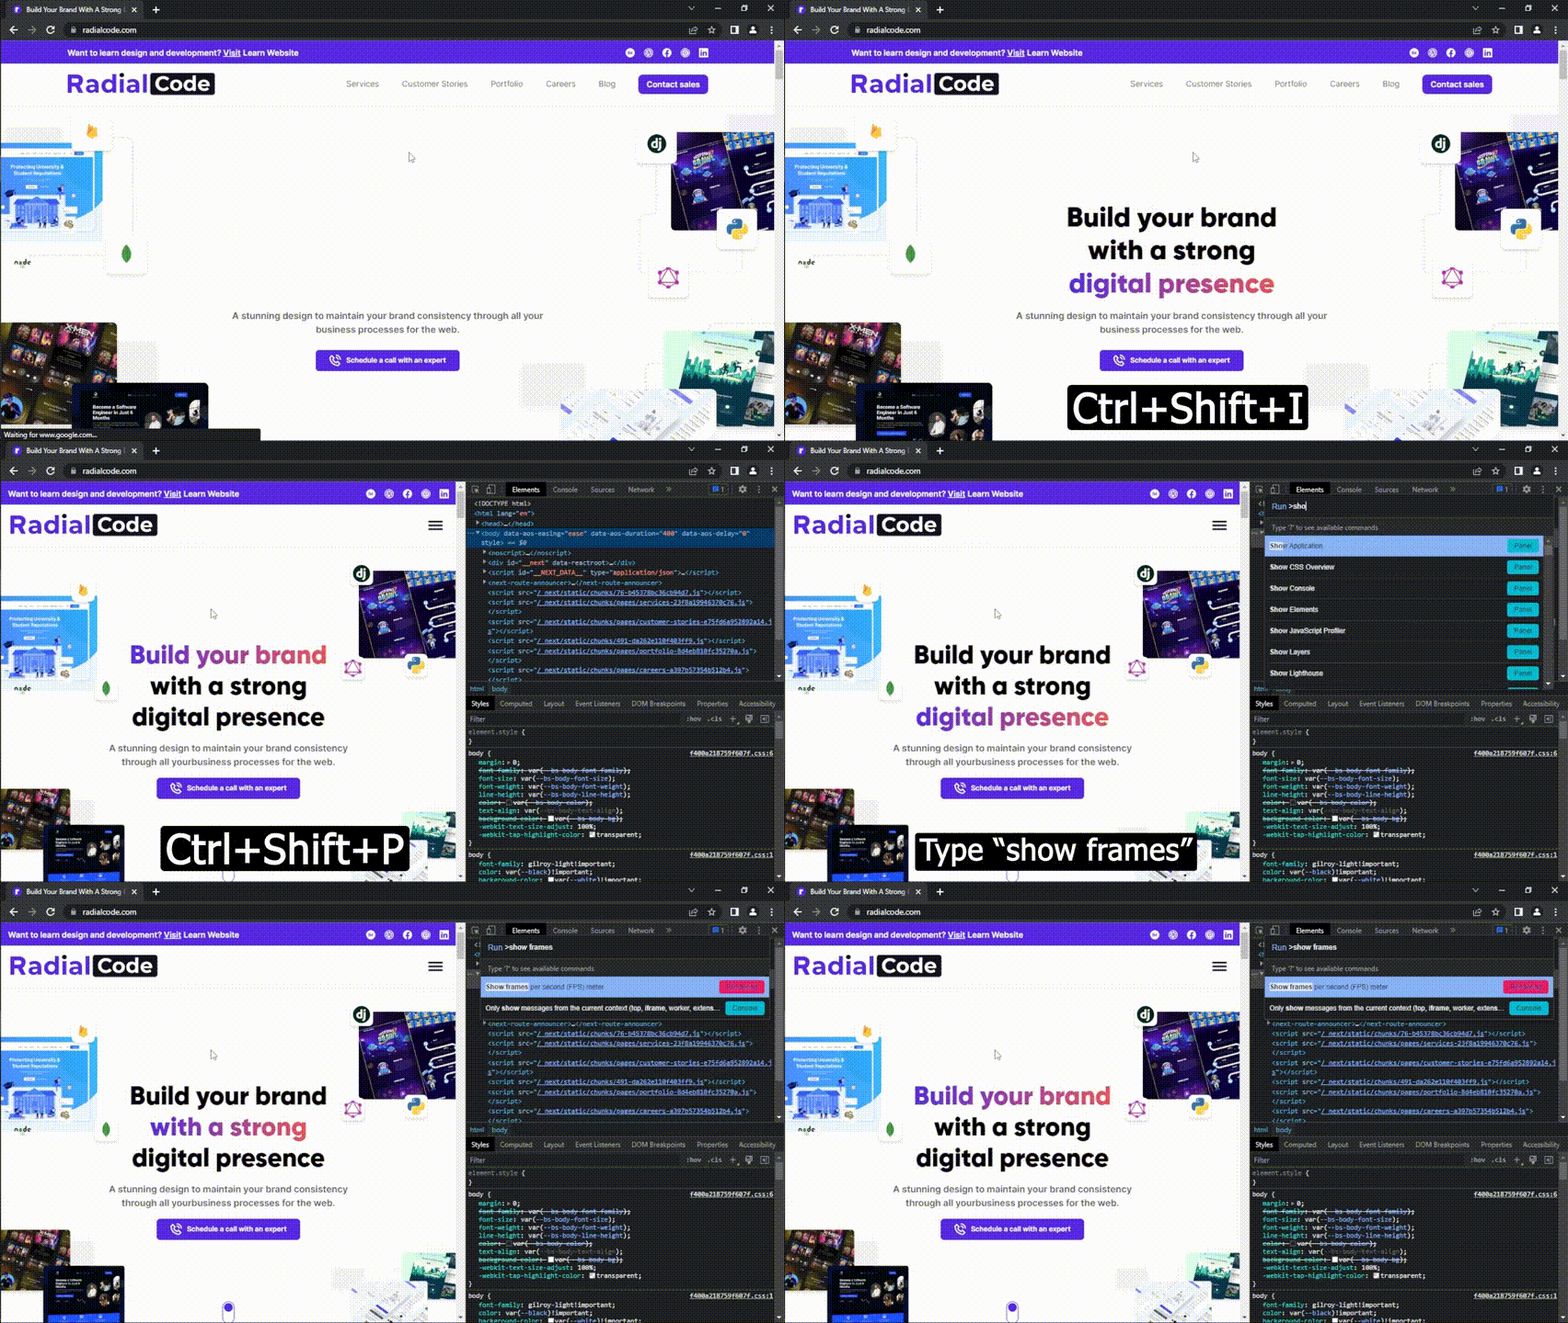
With Chrome's built-in FPS meter, developers can see the frame rates of web pages and fine-tune them for smoothness and performance.
To access the FPS meter, follow these steps:
- Open DevTools by going to Menu ➝ More Tools ➝ Developer Tools Ctrl+Shift+I
- Click View ➝ Command Menu Ctrl+Shift+P
- Type "show frames" and select the first option
Access Elements Without Writing Code
If you need to get access to an element on a webpage, the first obvious method is using Document Object Model (DOM) in JavaScript. For instance, the document method getElementById() returns an Element object representing the element whose id property matches the specified string.
To access elements without an ID, you can use querySelector() to find the element using any selector.
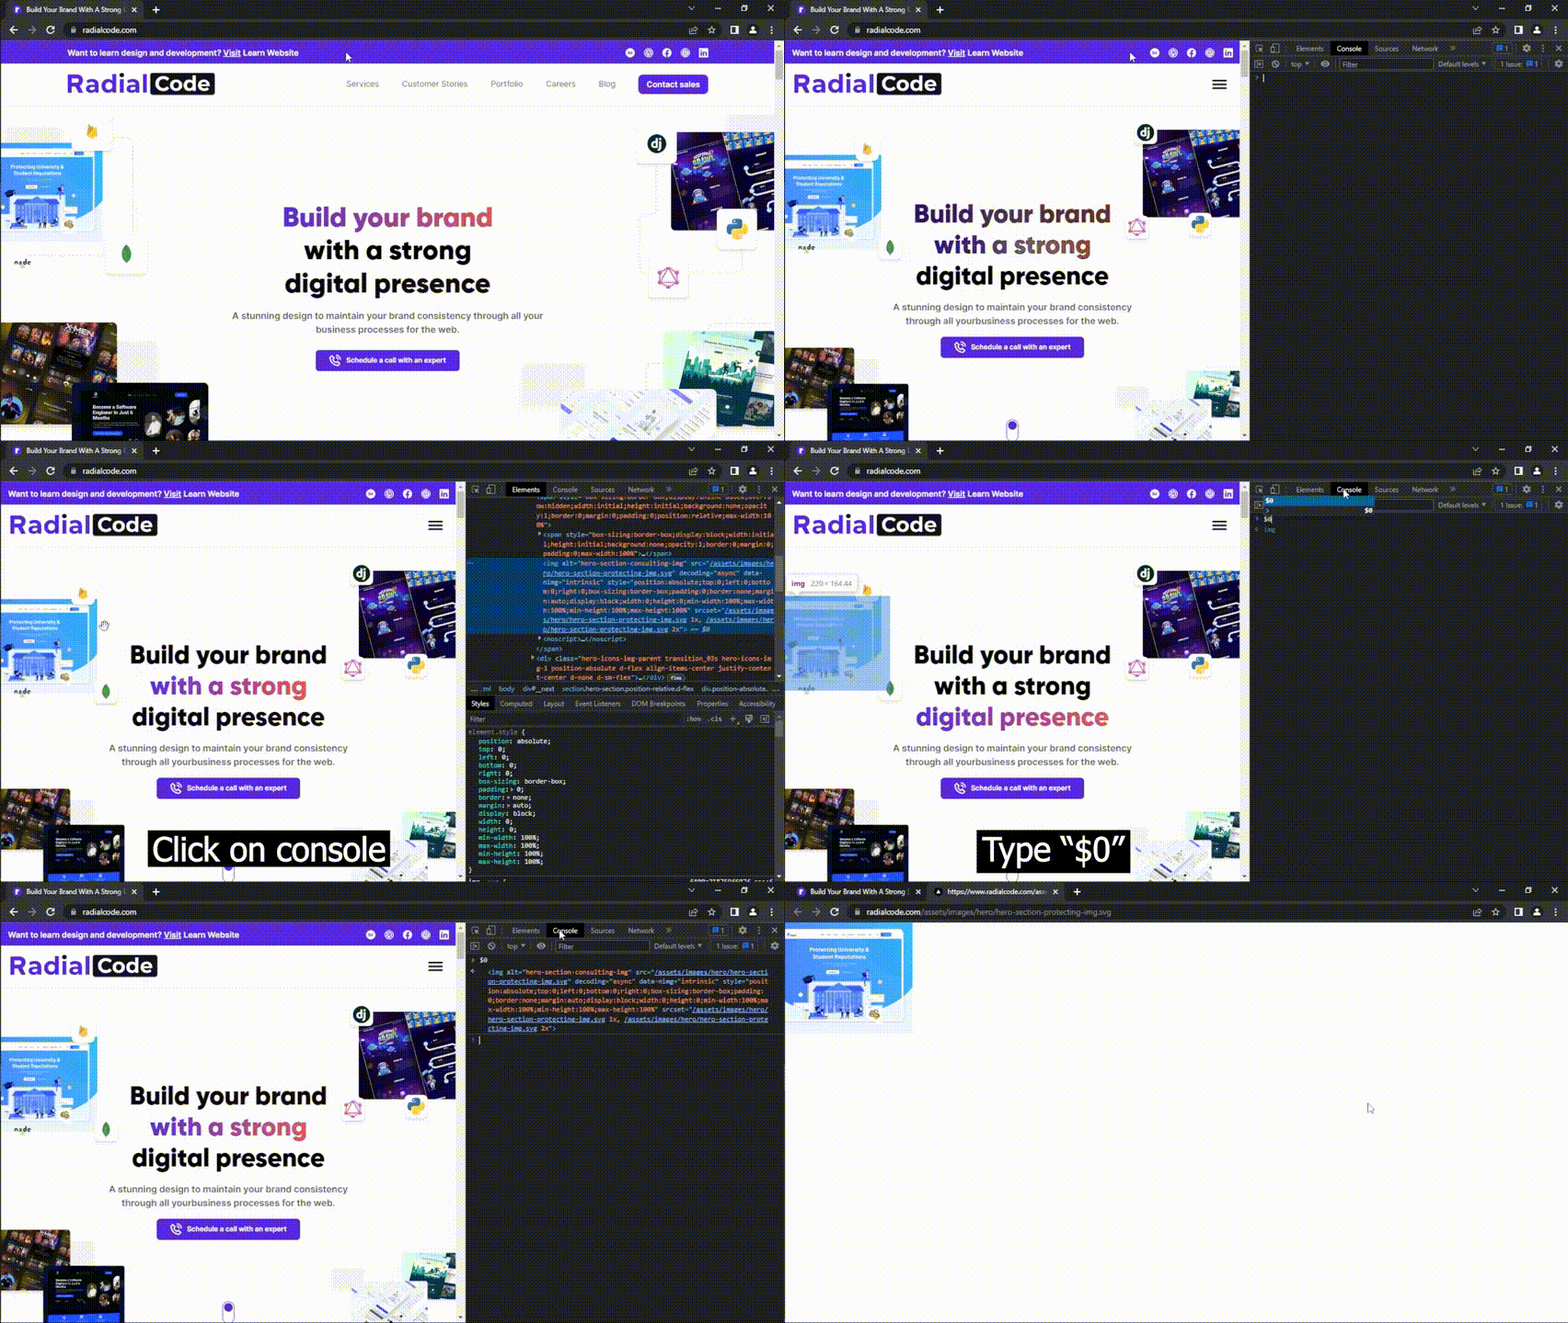
With the use of Chrome's console tab, you can get access to elements without writing any lines of code.
To try it, follow these steps:
- Open DevTools by going to Menu ➝ More Tools ➝ Developer Tools Ctrl+Shift+I
- Select Console Tab ➝ Clear console ➝ Select an element Ctrl+L Ctrl+Shift+C
- Return to the console tab ➝ Type $0 and hit enter
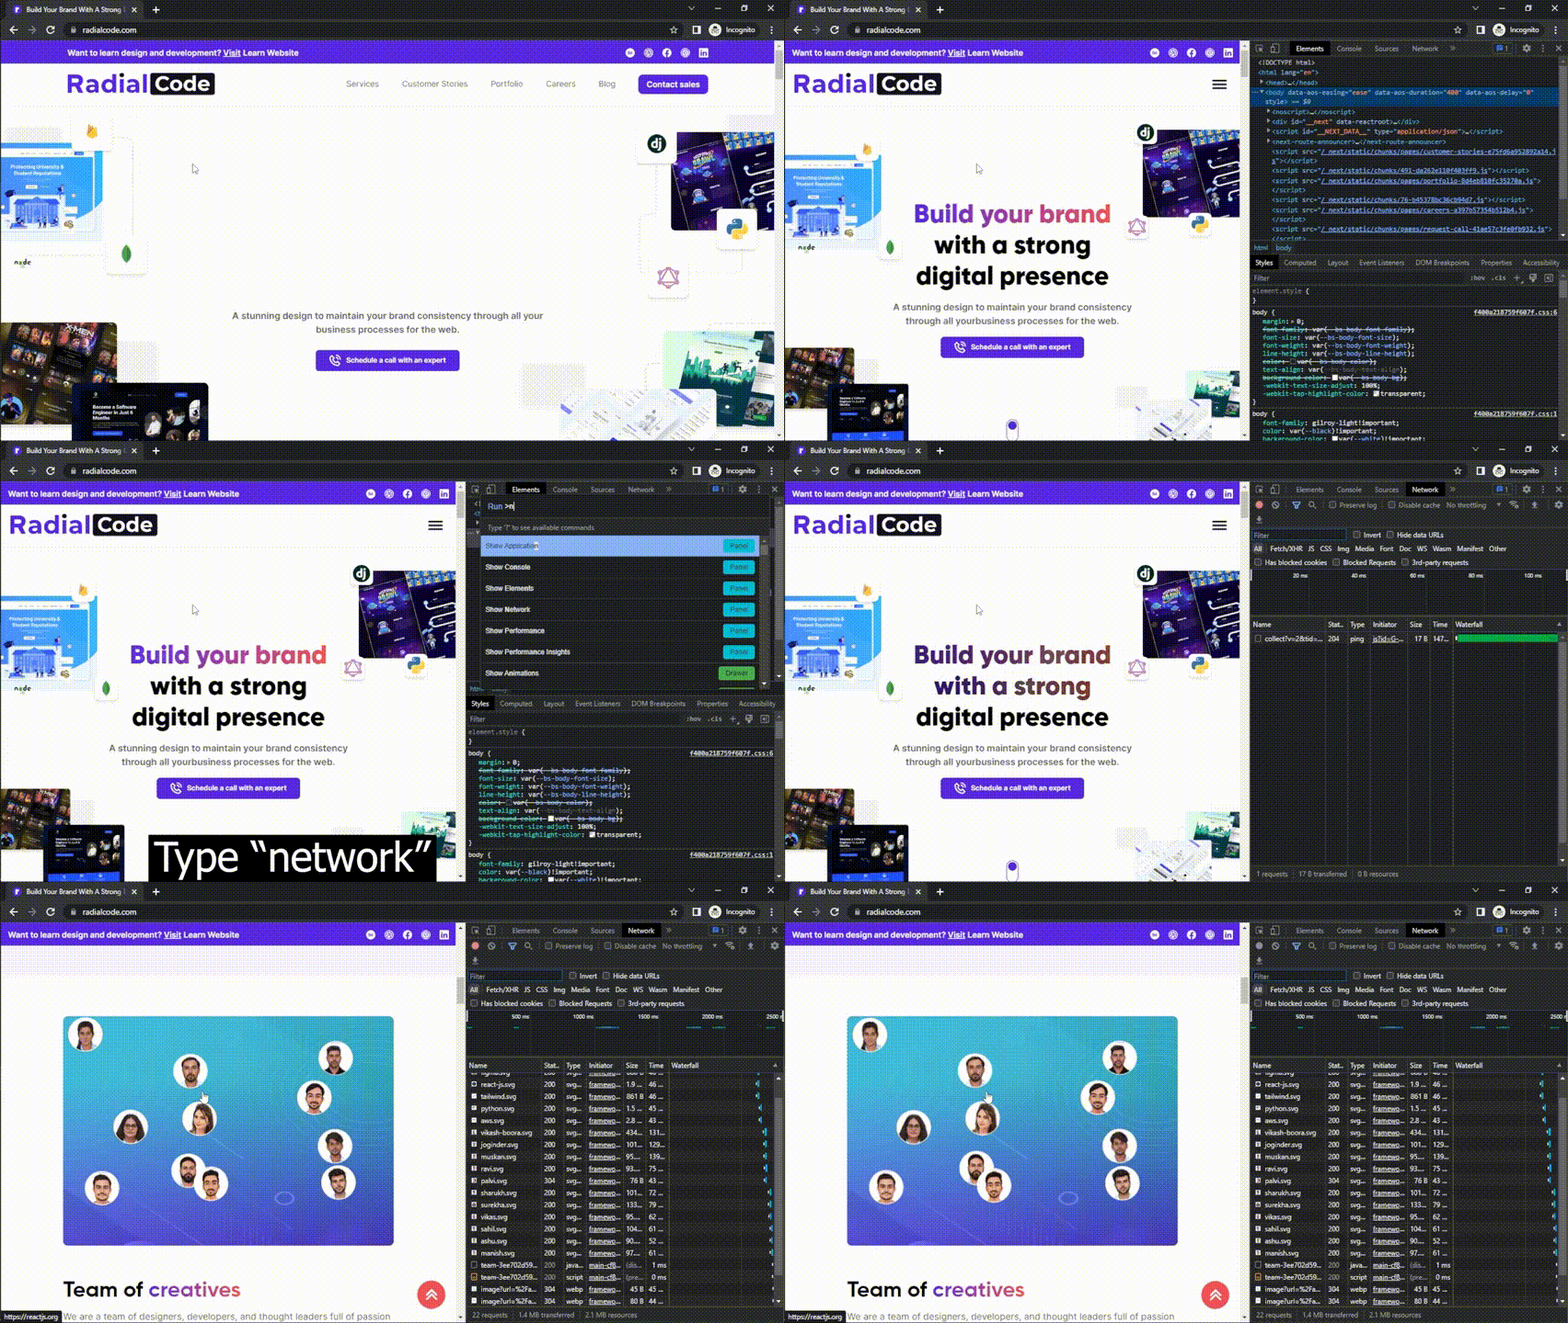
Network Tab
Building successful products require a robust integration between the client and server side. Whenever a user tries to perform a function on a website, the browser sends a request to the server. The server validates the request and returns the requested information as a frontend code, which the browser interprets and displays to the user.
Want to learn Coading? Visit Us.
Using Chrome's network panel, developers can identify and solve network issues, analyze website performance and optimize them.
As soon as you open DevTools, the network tab will start recording all network requests that can be sorted later. You can stop this recording process manually by clicking on the red button Ctrl+E and start analyzing different parameters like the size of the content that got loaded, the number of requests sent, how much data got transferred up to that time frame, etc.
Conclusion
There you have it — five useful Chrome dev tools that will help you optimize your development workflow.
Even if you're getting started or are a professional developer, Chrome offers everything you need to test and debug projects, and there are many extensions you can use to extend the browser's functionality. Ready to explore the full spectrum of Chrome's capabilities and optimize your development process? Schedule a call with our experts today and take your web development journey to the next level!
